…without using code!
You probably know that a document that is stored in a SharePoint document library can have multiple versions if Versioning is enabled for that document library. If this is the case that document have a version number that is displayed in SharePoint when you look at the item in the document library as a new column named ‘Version’
Wouldn’t it be nice to display this version number on the pages of your diagram
so they print and even better, update automatically as people check in new versions?
You can do this but it takes a few steps:
- Setting up the document library to expose the Version number as a label
- Data Linking your Visio diagram to the library and the document record
Setup the document library
- Login to SharePoint and navigate to the document library that is storing your Visio diagrams
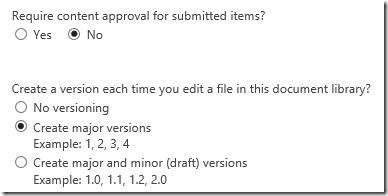
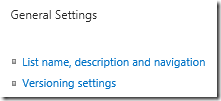
- Enable Versioning if it is not already enabled by opening the Library ribbon and selecting Library Settings

Feel free to choose the versioning options that best suit your needs

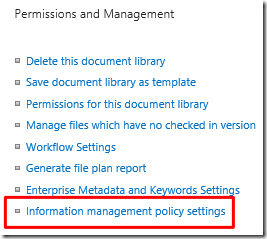
- Go back to Library Settings and in the Permissions and Management section, select Information management policy settings

- Select "Document" from the Content Types Section:

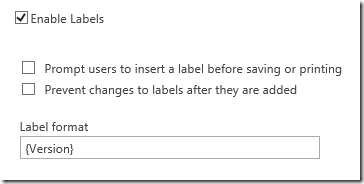
- Click Enable Labels and type in the Label format box enter
{Version}as shown below
- Click the "OK" button to save
Now this label is available as an additional column that can be queried by Visio. So on to the next step…
Data Link your Visio diagram
Data Linking is fairly straight forward. The trick here is that we will be linking to the document library that contains our Visio diagram and then we will be linking the record for our Visio diagram to one or more shapes in order to display the updated version number
Data Link to your document library using the Link Data to Shapes wizard and selecting the SharePoint List option.
After the data set is added to the diagram, find the record that matches your diagram and drag it to a shape on the page.
After you have linked this record to the shape you now have a Label property in Shape Data that can be used on Data Graphics or by using Fields in the shape text.


![clip_image002[4] clip_image002[4]](5807.clip_image0024_thumb_0B8B2C90.jpg)


![clip_image002[4] clip_image002[4]](4336.clip_image0024_thumb_204598EC.jpg)