Visio stencil for data import
|
Instrument for automatic creation of diagrams based on the data The stencil contains the Shape-Importer and a few macros. Creation of the diagram is reduced to copying the contents of the Clipboard into a shape and execution the Draw command. The stencil automatically makes all remaining operations. |
Buy on Gumroad |
Application area
Some Visio add-ons have a built-in tools, that allow users to import data and automatically create a diagram. Such tools are used in Organisation chart and Brainstorm diagram. But it is strongly specialized things.
If you have programming skills, you can write a macro to import data. But not everybody may programming and in addition this takes a time.
Here it is proposed a different way - a Shape-Importer. Shape contains some of the most common charting algorithm. All operations are as simple as possible. Creation of the chart requires only several clicks.
Naturally, this approach does not cover all the data import requirements. But let us hope that it will be among the familiar and commonly used tools.
General technique
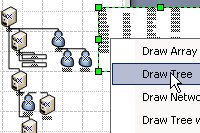
The stencil can be used in any document. It is only necessary to throw a portion of the data into shape-importer and execute the context menu. Shape performs all the necessary work and constructs the chart completely automatically.

|
See an example of the import and building network diagrams with data from Excel. The example contains following sequence of actions:
|
Variants of the data format
Shape-importer supports some of the most popular data formats.
|
One column - array of shapes |
|
2 columns - tree - the connected shapes, one master |
|
4 columns - tree, different masters |
|
6 columns - tree, different masters plus additional parameter |
There are 2 major modifications provided for placing shapes. Tree - for diagrams like Orgchart. Network - the nodes connected by straight lines. After construction, you can change the layout of the chart using a regular function.
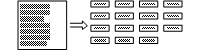
Array of shapes.
This function is used when you want to convert a set of rows in a lot of shapes. For example, there is a text algorithm to get a block diagram.

|
The picture shows the following operations in sequence:
After this, the ArrayController master is used:
|
Note. The features of ArrayController master are described below.
Rules. Source data should be placed in a single column. Each string is converted to one shape. The 2D shapes are produced based on the selected master. That is, by selecting different masters you will make different arrays. The input strings transfer to the shapes's text.
By default, the array contains 10 columns. The number of lines depends on the data volume. The intervals depend on the shape's size.
The stencil also contains the "ArrayController" shape.
The "ArrayController" shape provides the folloving abilities:
- rebuild an array of shapes, reducing or increasing the number of columns;
- change the offset between shapes horizontally and vertically (without changing the size of shapes);
- while holding down the Shift key, the increment will decrease ten times;
- set the exact area to fit the array of shapes;
- set the exact interval between the centers or edges of shapes.
By default, the shapes in array are connected. If you want to get an array of unconnected shapes, it is enough to select the shapes on a "connecting line" layer with the "Select by type" and remove them (menu "Edit / Select by type").
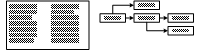
2 columns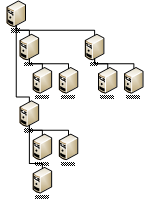
Typical using - display the links between shapes. For example, the organizational structure or data flows between the devices. In an example the following operations are shown:
As a result of import we see devices and communication between them, corresponding to the imported data. Data requirements. Data should be presented in two columns, separated by tabs. When you copy data from Excel or a database it is recommended to use an intermediate copy in a notebook while the separator is inserted by default. Both columns must contain the device's names (shape text). The first column - the source, the second - the receiver. (For organizational structure - Executive - Report To). All the nodes are represented by copies of a master, that is chosen at the moment of the Draw command execution. As a connector "Dynamic connector" is used. Shape-Importer uses two layout modifications, which differ by the method of shape's placement and line types: "Draw Tree" and "Draw Network". If you want another method, then after the import, you can change it manually or use the regular autoplacement functions. |
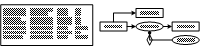
4 columns
This mode allows you to use different masters and various connectors. In the example the diagram is constructed using four different masters. Columns 1 and 2, as well in the previous example, define the source and receiver node. Column 3 contains the name of the master for 2D shapes. Column 4 - the name of the master for the connector. All nodes must be present in the first column. In case of root node column 2 should be left blank. All used masters must be present in the Document Stencil. Otherwise you will receive an error message, such as "Master Server is missing". To transfer the desired masters from the target stencil to the Document Stencil, you need to drop them to a page, then remove them. As a result, the copies will appear in the Document Stencil. By default the Shape-Importer works with local names of the masters. The paid version has the ability to switch to universal names. To do this, open the editor and change the value of the constant UseUniversal to True. The code of free version is not available, so this is not possible. |
6 columns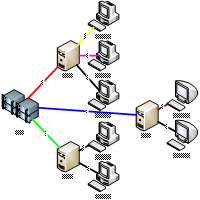
This mode, besides using different masters, allows you also to pass an additional parameter to them. This makes it possible to control the color, line thickness or configuration of shapes. The value of the control parameter (integer) will be entered in column 5 for the 2D shape and column 6 for the connector. The masters for such using must be previously prepared. The value is transferred to the "User.importP" cell. So ShapeSheet should contain the cell with such name in a "User-defined cells" section. And other (target) cell will contain the formula referred to this cell. The example below shows how to organize the dependence a fill color of shape with the imported parameter. If the "User.importP" cell is missing in master, then the "Draw with parameters" function will work the same way as the "Draw with masters" function. |
Differences between versions
There are two versions of the stencil: paid and free.
The code of the free version is closed and it occasionally displays a reminder of the possibility of buying the paid version. In other respects the two versions are identical. That is, you can download the free version, make sure that it suits you and then buy the paid version.
Open source allows you to ensure that existing macros are safe and allow you to create your own modifications to perform different or additional tasks.
Placement and using
All functionality is completely packed in the "import.vss" stencil.
Stencil does not require the installation or the presence of other components. However, for ease of use, better put it in the folder that Visio uses to store user's stencils. For example, in the My Documents \ My Shapes folder or that specified in the Visio settings. The correct location will facilitate the opening of a stencil from any necessary documents.
Technical support
In case of need you can contact the author with questions and suggestions by email mentioned below.