One of the new features in Visio 2007 Professional is Data Graphics - the ability to display data on shapes in rich, visual ways. Many of you have already experimented with this feature and are looking for ways to create custom visualizations. There is an MSDN article that covers the full spectrum of customizations possible for Data Graphics. In this post we'll work through a specific example - changing the text size in callouts.
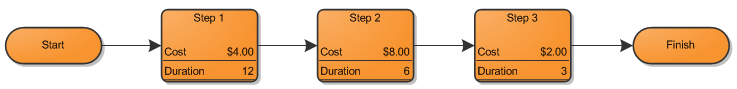
In the flowchart above, a data graphic is applied to the three process steps. The data graphic has two text callouts displaying the Cost and Duration shape data fields. The default text size for the flowchart shapes and the text callouts is 8 points. What happens if we do a Select All and change the text size to 12 points?
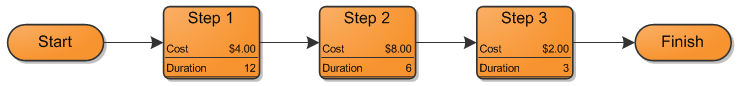
The flowchart shape text has increased in size, but the callout text has not. Normally when you apply formatting to a group shape, Visio automatically pushes that formatting to all sub-shapes as well. However, Data Graphics callouts are designed to prevent this automatic propagation. There are many scenarios where it is desirable to maintain separate formatting for the shapes and the callouts. Visio 2007 introduces a new protection on shapes to prevent group formatting from propagating to sub-shapes.
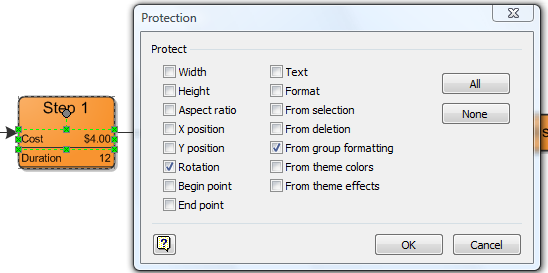
Group formatting protection does not prevent all formatting changes on a shape - just those pushed from groups. You can directly select (or sub-select) a shape and still format it. Data Graphics callout work this way. Not all Visio shapes allow selection of sub-shapes. This is controlled by the group selection behavior property found in the Format > Behavior dialog. If the selection property is set to Group Only, you will have to go to Edit > Open Group to make any formatting changes.
Thus it is possible to customize the formatting on individual data graphic callouts, but what about making a global change to the data graphic? The MSDN article explains more about the way that data graphics are structured, but essentially the callouts used in a data graphic derive from Visio callout masters. By editing the callout master, all the data graphic callouts can be changed. You may be accustomed to opening the Document Stencil to edit masters, but Data Graphic callouts are hidden masters. Go to View > Drawing Explorer to find them.

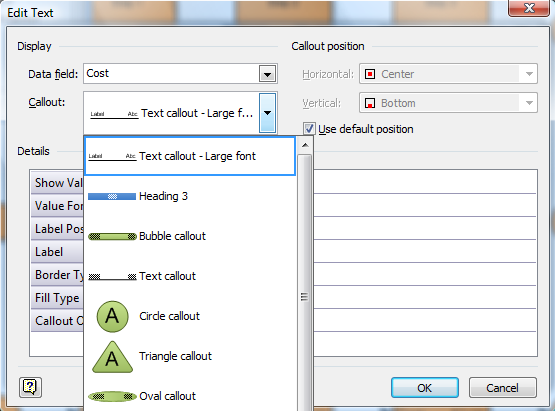
In the Drawing Explorer, you will find masters for the flowchart shapes in the diagram. There are also masters for the data graphics and the callouts used in the data graphics. For our example, we want to edit the Text callout master to update the text font size. You can right click on the master name, choose Edit Master Shape and make the desired formatting changes. Once you close the edit window and save the changes, all the data graphics in the diagram are updated.

It is a good idea to rename this callout master. Because this version of the text callout master is different from the built-in one, Visio will offer both in the Edit Data Graphic dialog. Assigning a new name will allow you to distinguish between the two.
You may want to make your custom data graphic callout available in all your documents. Visio 2007 does not offer a central storage location, so the recommended practice is to put the data graphic and callout masters into a template that you can use as you start each new diagram. You can use the custom callout in a data graphic on a shape in the diagram. Then copy that shape to another document. Visio will copy over all necessary data graphic and callout masters. We're interested to find out what types of custom data graphics you create to visualize information. Be sure to let us know how you use the feature.