Data Graphics is a great new feature in Visio 2007 Professional for displaying data on your shapes. One key to the feature's popularity is that you can make or customize your own data graphic callout shapes. There is an article posted on MSDN that covers the full spectrum of customizations possible for Data Graphics. Also check out this post that discusses customizing a data graphic callout. In this post we're going to create a text callout from scratch.
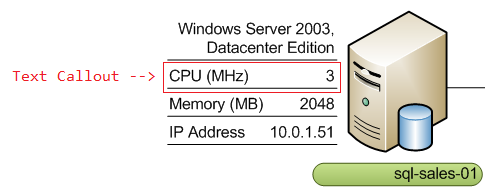
A text callout is one of the four ways that you can visualize data using Data Graphics. It performs the basic role of showing data as text labels on the diagram. In the picture above, there are four text callouts to the left of the Server shape and one below the shape. Some callouts display just a value; others include a field label. The formatting and geometry are as customized as you want to make them.
To create a brand new text callout, we need to create a shape with the look we want and then configure it to work with the Data Graphics feature. For this example we'll do just the minimum steps needed to get things working. We draw a rectangle on the page and open its Shapesheet. In the Shapesheet, we need to insert a User-defined section and a Shape Data section.
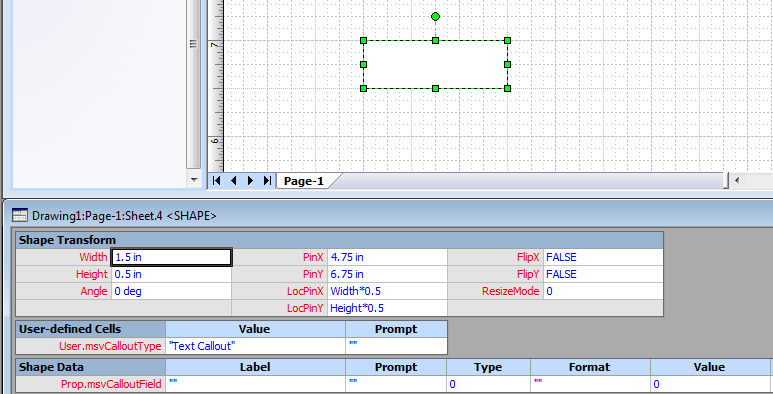
There are just two things needed to make this shape a data graphic callout. First, change the row name of the User-defined row to User.msvCalloutType (click on the row name and type "msvCalloutType"). In the Value cell enter "Text Callout" - including the quotation marks here. Second, change the row name of the Shape Data row to Prop.msvCalloutField (click on the row name and type "msvCalloutField").
Visio uses the User.msvCalloutType value to determine where to surface your custom callout shape in the Data Graphics user interface. This shape will appear in the Callouts list in the New Text / Edit Text dialog. Visio populates the Prop.msvCalloutField value (the Value cell in this row) with the data to display at the time the data graphic is applied to a shape on the page. To make it easier to continue building the shape, you may want to put some text in the Value cell to serve as sample data.
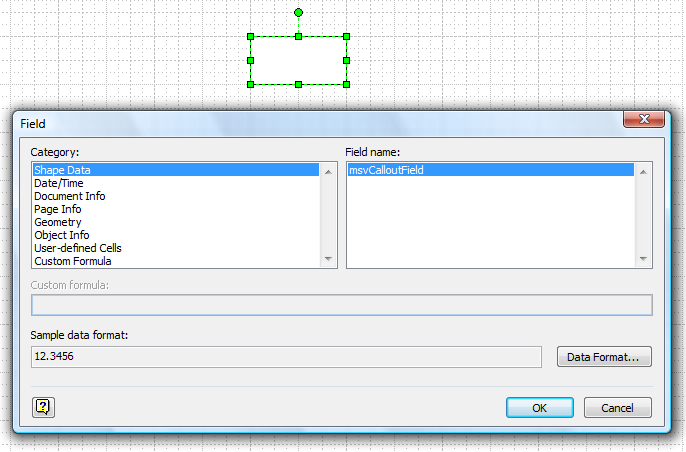
What's missing from this shape is the actual display of the data as text. This is typically done using Text Fields. With the shape selected in the drawing window, go to Insert > Field and choose the msvCalloutField in the Shape Data category.
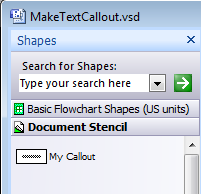
Now we can test this shape. Drag it into the Document Stencil to create a Visio Master shape. Give the master a name.
Now drop a shape on the page and give it some data. The Basic Flowchart Shapes are a good test bed since they have three built-in Shape Data fields. You can right click on the flowchart shape and choose Data > Shape Data to fill in some values. Now right click again and choose Data > Edit Data Graphic to create a new data graphic with your callout.
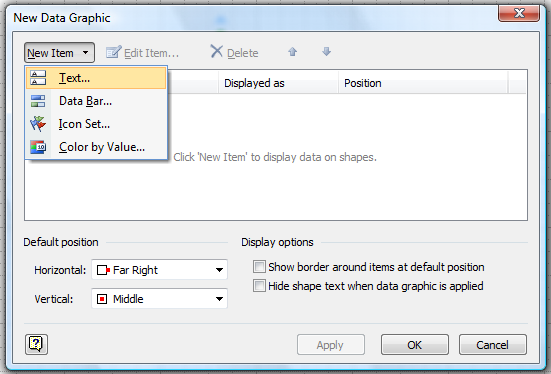
Because we set the User.msvCalloutType to "Text Callout", we need to go to New Item > Text. In the New Text dialog open the Callout dropdown to see the custom callout shape we made.
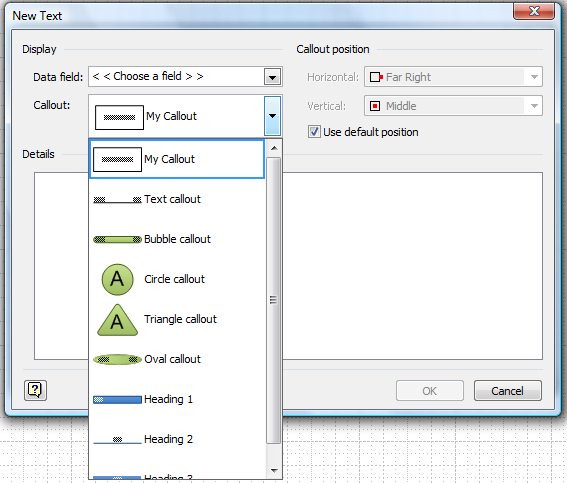
Choose the custom callout and then a Data field to display in the callout. Finally click OK twice to see the callout applied to the flowchart shape as a data graphic.
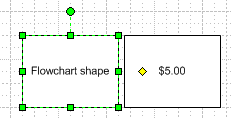
Go ahead and change the Shape Data in the flowchart shape to see it update in the data graphic. Now we have a functioning text callout. What remains is whatever customizations you want to make to enhance the visual appearance of the callout. Perhaps you want to apply formatting or tailor the geometry. Perhaps you want to add configurable settings that the user can select in the New Text / Edit Text dialog. See the MSDN article for more information about adding this functionality. As always, you can look at the callouts that are built into the Data Graphics feature for examples of more sophisticated behaviors.
If you have some suggestions for new data graphic callouts, post a comment. We'd like to hear from you. In the next post we will look at an example for Data Bar callouts.
