One final post about Data Graphics before turning to other topics for a while. We've gotten some great feedback from customers about their usage of Data Graphics. Based on comments and observations of users, there are a few points of confusion that people are encountering. This post explains the most common issues with the Data Graphics feature.
I modified the data graphic on one shape and all my shapes changed
Users encounter this when the same data graphic is applied to multiple shapes. They select one shape and edit its data graphic only to find that the data graphic was updated on the other shapes as well. When you edit the data graphic on a shape using the Edit Data Graphic command, you are actually changing the definition of the data graphic used everywhere.
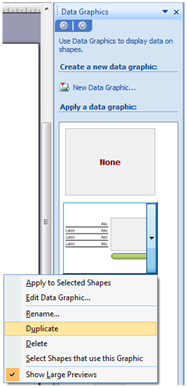
If you really want to change the data graphic on some of the shapes, you need to assign a different data graphic to those shapes so that they act independent of the rest. Go to Data > Display Data on Shapes to open the Data Graphics task pane. Right-click on the data graphic currently applied and click Duplicate. Then select the shapes you want in the drawing and click on the duplicate data graphic to apply it. You can continue to modify the new data graphic and only affect the shapes you chose to apply it to.
How do I switch between Text Callouts and Data Bars?
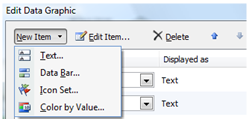
With Data Graphics you can display information using Text Callouts, Data Bars, Icon Sets or Color by Value. These are the choices when adding new items in the Edit Data Graphics dialog. Unfortunately, once you choose the type of graphic for an item, you cannot switch to one of the other types. This is a limitation of the feature. You will have to delete the item you have and add a new one with the type you want.
Sometimes I can't select the data graphic in the diagram
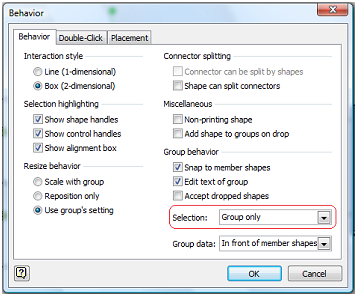
Visio adds data graphics to shape in the diagram by inserting them as sub-shapes of the target shape. The ability to select the callout sub-shapes is then dependent on whether the target shape allows it. Go to Format > Behavior and look at the Selection property. "Group only" means that sub-shapes cannot be selected. Change this to "Group first" or "Members first" to all selection. A common reason to select callout sub-shapes is to apply local formatting to them.
My Data Bar doesn't show the correct percentage value
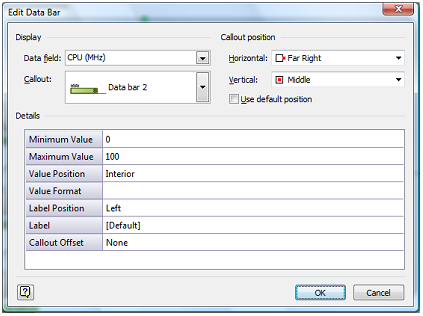
The default Minimum and Maximum values for a Data Bar are 0 and 100. This makes it seem like the Data Bar naturally displays percentage values with 100 being the largest data value and 0 being the smallest data value. However, that is not how Data Bars work. The Min and Max properties are actual values. If your data field has values in a different range, you need to update the Min and Max properties to match your data range.
How do I reset the position control handle?
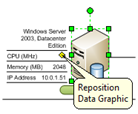
Visio adds a control handle to target shapes for easy repositioning of the data graphic. This allows you to customize the location of the data graphic on a shape-by-shape basis. Changes to the position property in the data graphic definition do not override the custom position you designate.
If you would like to reset the position control handle so that it uses the data graphic position property, you must remove the data graphic and reapply it. Go to Data > Display Data on Shapes to open the Data Graphics task pane. Select your shape and choose the None data graphic. Then click on the previous data graphic to reapply it.
Data graphics don't appear when I apply them to pictures or images in my diagram
Data graphics cannot be applied directly to pictures or embedded objects. Visio is unable to convert these shape types to groups so that callouts can be inserted. The typical workaround in this case is to group the picture or object and then apply the data graphic to the group. You also have to move your data to the group shape. There is a KB article explaining the procedure: http://support.microsoft.com/kb/923596/en-us
Want to know more about Data Graphics and visualizing information?
If you have mastered the basics and want to go further with Data Graphics, there's a new book available for Visio 2007. The book is Visualizing Information with Microsoft Office Visio 2007 by Visio MVP David Parker. You can read a review of the book on Chris Roth's Visio Guy blog.
