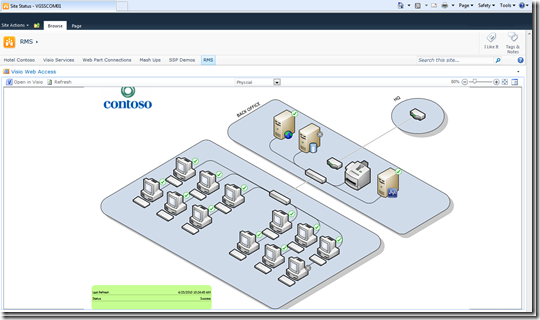
We enjoy seeing the innovative solutions that are implemented on the Visio platform. Now, with Visio 2010 and Visio Services, we’re starting to see some great new solutions that weren’t possible before. A good example is the Visio 2010 add-in for System Center Operations Manager 2007 R2. This add-in, which was originally released for Visio 2007, lets you generate a data-linked Visio diagram from Microsoft System Center Operations Manager. Visio’s data graphics are used to show the health of applications, services, and infrastructure monitored by Operations Manager. For instance, the status of a database server can be shown with an icon on the shape or by changing the shape’s color.
The diagram can be customized in Visio to show the information in a variety of contexts, such as a network topology, datacenter floor plan, rack diagram, or map.
The latest version of the add-in has been updated to work with Visio 2010 and allows the diagram to be viewed in SharePoint using Visio Services. The diagram remains connected to the Operations Manager data, and the data graphics will update as status changes occur. In this way, it can be used as a live dashboard that is viewable in a browser without requiring the Visio client.
In short, this add-in demonstrates how Visio Services opens up new scenarios for visualizing real-time data in the browser and how Visio developers and partners can build powerful new solutions that take advantage of Visio Services.
Please continue to let us know what you think and comment on our blog!


