Spring has arrived and baseball season is upon us! Whether you follow the professional leagues, play recreationally or coach in the little leagues, there is one thread that ties all baseball enthusiasts together – a passion for stats. In this article and the attached diagram, we present a baseball scoring sheet that you can use to track the action in each game. You can use the diagram as-is or customize it to your liking.
Print and Go
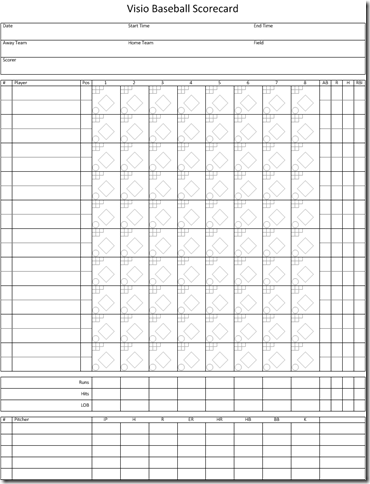
The Visio Baseball Scorecard is intended to be printed and filled out by a scorekeeper during a game. It includes a section for game data at the top, the batting order and details for each at bat, and sections for batting and pitching totals at the bottom. Don’t know how to score? Here is a link to an online tutorial.
Customizing the Diagram
The diagram is designed with customization in mind. Here are some of the special capabilities of the shapes that make up the diagram.
Fill in fields using tabs
You may want to pre-populate your diagram with information before the game starts. Maybe you have a standard player roster or want to fill in the game summary information at the top of the sheet. Every shape in the diagram is designed to accept text. Click on a shape and start typing. Use the Tab key to jump to the next text field position on the shape.
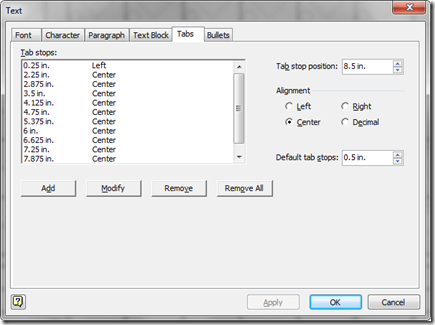
For those curious how this was set up, the tabs were created using the Text dialog, where you can add tabs at specific text positions and even control the alignment of the text around the tab stop. You can get to the dialog by right-clicking on the shape and choosing Format > Text. Then choose the Tabs tab.
Change the game summary fields
The Game Info shapes at the top of the page have Shape Data fields that allow you to customize the information shown. Right-click on a shape and choose Data > Shape Data to see the Shape Data window. Then fill in your own field labels.
Change the number of position substitutes
The player rows in the middle of the page are designed to list 1, 2, or 3 players at each position. Having more than one row of data allows you to record position substitutions in the game. By default each Player Row shape has room for two players, but you can change this in Shape Data. Press Enter after a row of text to fill in the next line.
Choose your summary stats to record
The Sum Row shapes below the player rows allow you to total your stats in each column above. If you want to record a different stat on each line, choose a different label name in Shape Data or enter your own in the Shape Data Window.
Summary
Download the attached Visio diagram to print the scorecard for recording during the game. You can also customize the diagram by pre-filling in text boxes or using Shape Data to change the fields. For those interested in shape development, you can dig into the ShapeSheet to see how these shapes are constructed. Most of all enjoy the baseball season!
Please send us your comments and also suggestions for future topics.


