Overview
Business analysts have the unique challenge of accurately depicting complex business processes which can assist an organization in becoming more effective. Business process mapping begins with requirement capturing from multiple stakeholders and goes through several iteration cycles before the final process diagram is documented.
Two powerful tools that help a business analyst to accomplish this task are Microsoft Visio and Excel. With Visio Data Visualizer, we bring together the best of both Visio and Excel to facilitate bi-directional process modeling. Use the Data Visualizer templates to automatically create a detailed, polished Visio flowchart from an Excel workbook. Visio now supports two-way synchronization between the Visio diagram and the Excel workbook. Not only can you create the flow chart, by editing data in Excel and refreshing the diagram from Visio, but you can also make changes to the Visio Diagram and then update the Excel data from the diagram.
Availability
If you are an Office 365 subscriber with Visio Online Plan 2, you can use the Data Visualizer feature. The ability to make changes to the Visio diagram and update source Excel is available from build 16.0.9126.2116 or later. To check your build in Visio, click on File -> Account. If you are on the Semi-annual Channel, you can move to a Monthly channel to get updates faster. To switch your channel, refer to this article.
Scenarios to try
One Click Create
To help you get started quickly we have introduced a single-click diagram creation experience from Excel.
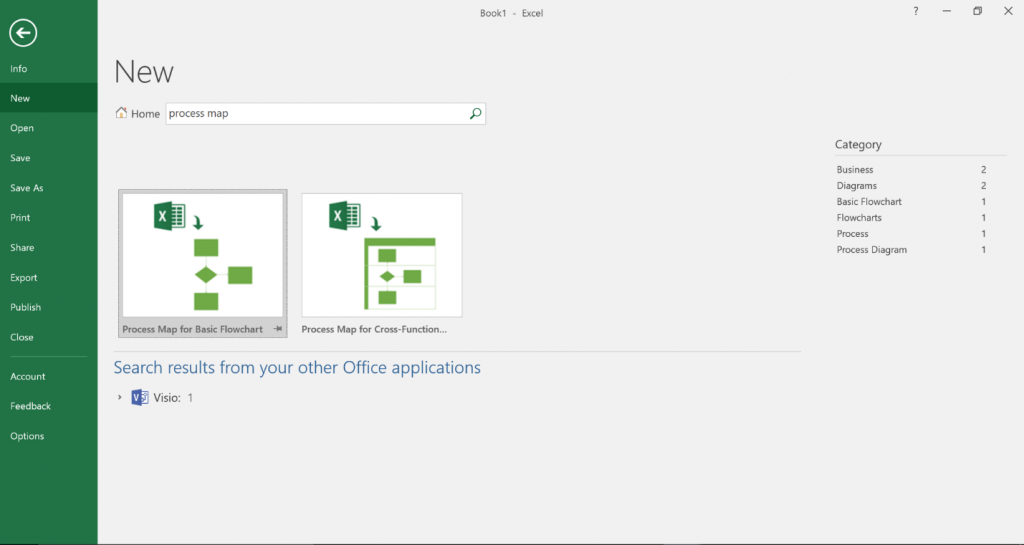
1. Open your Excel desktop app and go to File > New
2. Search for ‘process map’ in the template search box
3. Depending on your requirements, start with either the Process Map for Basic Flowchart or Cross-Functional Flowchart Excel templates
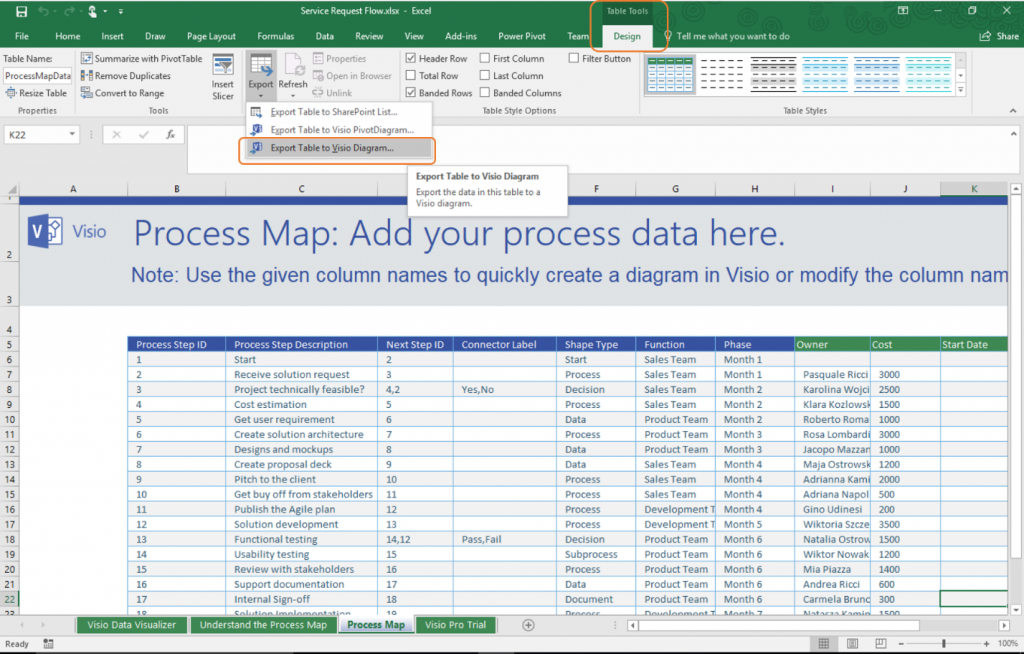
4. Enter your process steps in the sheet called ‘Process Map’
5. Select the process map table, go to Table Tools Design Tab > Export > Export to Visio Diagram to automatically create the diagram in Visio
Customize Diagram Creation
If you wish to customize your diagram creation, that is, use custom column names in Excel, change relationship settings from Next Step to Previous Step or use other flowchart stencils in Visio for diagram creation, please refer to this article.
Synchronizing the data and the diagram
After you create a diagram with Data Visualizer, you may want to make changes to it. Visio supports bi-directional synchronization between the linked Excel workbook and the Visio diagram.
To modify the data in Excel and then refresh the Visio diagram
1. In Excel, make changes to the source data in the Excel table. You can add, update, or delete rows
2. Save the Excel workbook
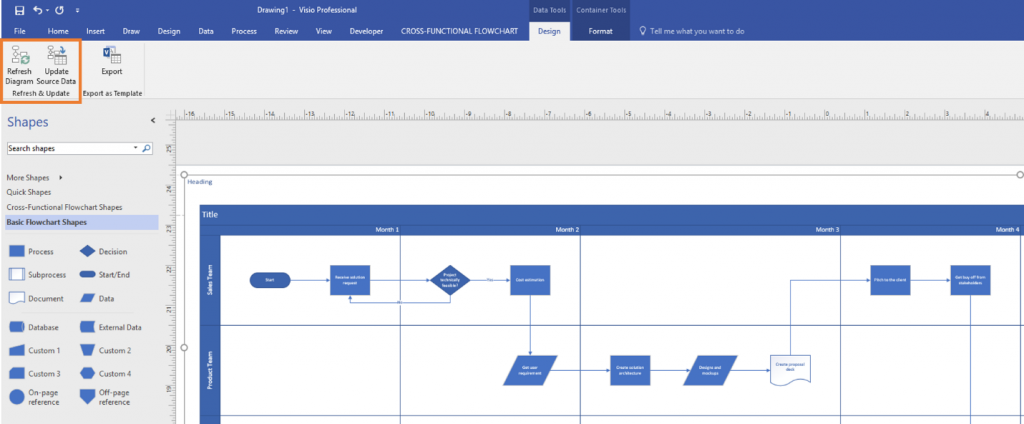
3. In Visio, click in the diagram container to enable the Data Tools Design tab in the ribbon, and then select Refresh Diagram
To modify the content in the Visio diagram and then update the data in Excel
Make changes to the Visio diagram. You can add, update, or delete shapes and connectors
2. If the Excel workbook is on a desktop computer or network file server, make sure it is closed
3. Click in the diagram container to enable the Data Tools Design tab in the ribbon, and then select Update Source Data
Tip: Keep both files synchronized and up-to-date after you finish working with them. When you change the Excel data, refresh the diagram; when you change the diagram content, update the Excel data.
Feedback
We’re constantly looking for ways to improve Visio and invite you to send us your ideas through our UserVoice site. For questions about Visio Data Visualizer templates and other features, please email us at dv-feedback@microsoft.com. You can follow us on Twitter, LinkedIn, Facebook and YouTube for latest on Visio.
— Shashank Gandhi | Program Manager | Microsoft Visio


