After spending a couple days chatting with people here at TechEd, I am amazed at how many people have already downloaded and have been playing around with Visio 2007 Beta 2. If you don’t have it yet, you can check it out here. In particular, a lot of people have seen the Data Graphics feature and have started to do really interesting things with it.
One of the most common questions I have gotten is around how to customize Data Graphic callouts. For example, people want to be able to add a thinner data bar, a new text callout that has different text or a different look from the built in ones, or a icon set that is customized for their particular domain. We’re putting together full documentation on how to do this, but while we’re waiting for that I’d like to give the more adventurous a primer to get going. For this post I’ll assume that you have some understanding of Masters in Visio and the ShapeSheet.
First, make sure to check out Eric’s post on the basics of using Data Graphics. The Data Graphic that you apply to a shape is made up of multiple graphic items, each of which are just a Visio master with some special properties. In order to create new graphic items, the easiest thing to do is copy an existing one.
To copy a graphic item, do the following:
-
Drop a shape containing shape data (for example, a network shape) on the page.
-
Select the shape and go to “Data>Display Data on Shapes…”
-
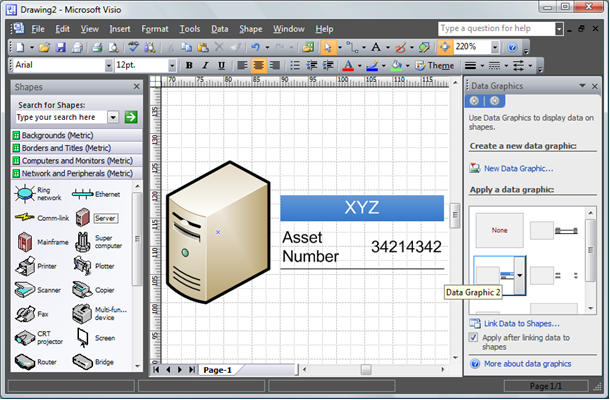
In the task pane that appears, click on the Data Graphic below the “None” Data Graphic (should be called “Data Graphic 2”). You should see something like the below:

-
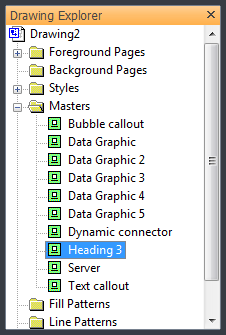
Go to “View>Drawing Explorer Window”
-
Expand the “Masters” section and then right click on the “Heading 3” master and select “Duplicate” from the context menu. :

-
This will result in a new master, called something like “Heading3.13”. Rename that new master to something recognizable like “My Heading”.
-
Right click on “My Heading” and select “Edit Master Shape” from the context menu.
-
You are now in master editing mode. You can modify the shape. For example, increase the font size to 12 point and change the color to Orange from Blue.
-
Close the window and click “Yes” to update the shape.
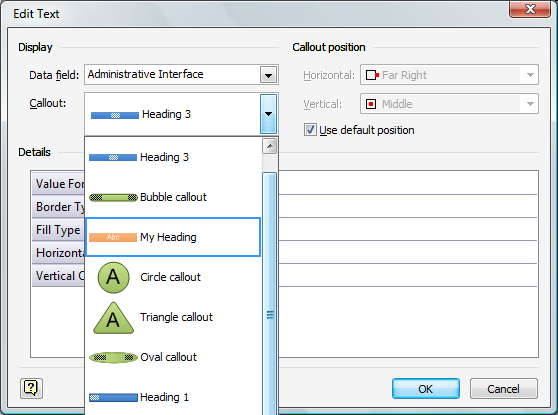
The new text callout type is now there and ready to use in this document. You can use it just as you do any of the built in graphic items. Just edit the Data Graphic you are using (Data Graphic 2), edit the first existing text box, then select “My Heading” from the dropdown list of available callouts: :

Now that you have created this graphic item, you can move it from document to document and it will then be available in both the UI and programmatically. Editing other item types (data bars and icon sets) can be accomplished in a similar way.
A couple more tips to get you started:
-
The master name for the default Data Graphic item will match up with its name in the Data Graphic dialog. Just make sure that you use the item first to make sure that it is added to that particular document.
-
Data Graphic items essentially conform to an interface for their particular item type.
-
Check out the User cells in the ShapeSheet to see what is involved.
-
Icon sets usually use multiple geometry sections to represent the various possible states.
That’s it for now. When we have more documentation I’ll update this post to point to it, but hopefully this will be enough to get people started.
Update: I've added some information specifically on customizing icon sets.
