Many of you are familiar with the work we did in Visio 2007 to make it easier to surface data that exists in your diagram in a visual form. Data graphics allow you to add refreshable data visualizations to the shapes in your diagram. See our previous posts Microsoft Office Visio 2007 Released and Customizing Data Graphics for more information.
| No data | Data graphics! |
 |
 |
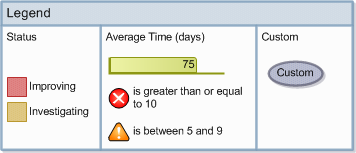
One thing users have asked us for is a way to describe the data graphics used in the diagram – a legend. Visio 2010 adds the ability to insert a legend that documents the data bars, icon sets and color by values in data graphics applied to shapes on the page. You can do this using the Insert Legend button on the Data tab.
Visio creates the legend at the upper right corner of the page. The legend contains a separate section for each data field referenced in the data graphics’ definitions. The descriptions for each legend item are obtained from the data graphics.
The legend is customizable, so you can add, remove and rename sections and shapes to make the legend look just right for your particular diagram. Legends also pick up the theme applied to the page, or they can be manually formatted.
The legend is made up of a number of shapes and uses containers to keep the different parts of the legend organized. The top-most shape is a list, a special type of container that arranges its members in a regular, linear pattern. The members of that list are containers, each of which represents a data field from the data graphics. Inside each container is another list, this one invisible, which keeps the individual legend items neatly arranged.
You can select a legend item and use the arrow keys on your keyboard to reorder them, or you can drag them around the list. You can also drag them out, delete them or drag your own shapes in. The same can be done with the containers that correspond to each data field. If you click the blue insert arrow on the outer list, Visio adds an empty container for your own use. While this will not have the inner list, you are free to add any shapes you wish.
To preserve the customizations you might make to the legend, Visio does not update it as you edit your data graphics or change which data graphics are applied to shapes on the page. Simply insert a new legend once you are done making changes. Delete the existing one or move it out of the way if you need to bring anything over.
Finally, for the developers out there, you can drop a legend using Page.DropLegend in the Visio API and specify custom outer list and field container masters.
We’re happy to be able to close this gap in data visualization and are interested in your feedback via Send a Smile or a comment here on the blog.


